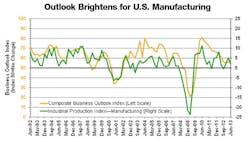
Manufacturing momentum is picking up after a slow stretch, according to the quarterly Manufacturers Alliance for Productivity and Innovation (MAPI) BusinessOutlook released today.
The survey’s composite index, a leading indicator for the manufacturing sector, advanced to 58 in June from the 56 reading in the March survey. This marks the second straight quarterly advance after 10 consecutive quarterly declines. For the past 15 quarters, the index has remained above the threshold of 50, the dividing line separating contraction and expansion.
“The improvements in the composite index and a number of individual indexes, though modest, are encouraging given that manufacturing sector activity in the late winter and early spring had slowed from its pace at the end of 2012 and early 2013,” said Donald A. Norman, Ph.D., MAPI senior economist and survey coordinator.
In a supplemental section, participants were queried on issues concerning healthcare reform. MAPI reported current sentiment seems to favor the status quo, with only 9% of the respondent firms indicating they are considering eliminating healthcare plans and directing employees to exchanges. Approximately one-third of the companies said they were considering eliminating higher-cost (“Cadillac”) healthcare options.
Close to one-fourth of the companies have considered or are considering plans in which premiums paid by employees vary with their level of compensation.
Individual Indexes
The composite business outlook index is based on a weighted sum of the prospective U.S. shipments, backlog orders, inventory, and profit margin indexes. In addition to the composite index, which in this survey reflects the views of 54 senior manufacturing executives, the report includes 13 individual indexes that are split between current business conditions and forward looking prospects.
Current Business Condition Indexes:
- Backlog orders index, which compares the second quarter 2013 backlog of orders with that of one year earlier, jumped to 54 in June from 43 in the March report.
- Current orders index, a comparison of expected orders in the second quarter of 2013 with those in the same quarter one year ago, improved to 53 from 47.
- Inventory Index,based on a comparison of inventory levels in the second quarter of 2013 with those in the second quarter of 2012, advanced to 51 in June from 48 in March.
- Capacity utilization index,which measures the percentage of firms operating above 85 percent of capacity, rose marginally to 21.2 percent in June from 20.7 percent in March. It is still below the long-term average of 32 percent.
- Export orders index, which compares exports in the second quarter of 2013 with those in the same quarter in 2012, remained flat at 45.
- Profit margin index fell to 56 in June from 62 in March.
Forward Looking Indexes:
There were increases in five of the seven forward looking indexes.
- Interest rate expectations index climbed to 81 from 58, indicating that a growing majority of respondents believe that longer-term interest rates will rise by the end of the third quarter of 2013.
- Prospective U.S. shipments index, which reflects expectations for third quarter 2013 shipments compared with those in the third quarter of 2012, rose to 67 in June from 61 in March.
- Prospective non-U.S. shipments index, which measures expectations for shipments abroad by foreign affiliates of U.S. firms for the same time frame, advanced to 60 in the current report from 53 in the March survey.
- Research and development spending index was 73 in the June report, an increase from 68 in March, and compared spending for the years 2012 and 2013.
The two investment indexes were split. The U.S. investment index is based on executives’ expectations regarding domestic capital investment for 2013 compared to 2012. The index was 65 in June, a slight increase from 64 in the March survey. The non-U.S. investment index declined to 53 in the current report from 62 in March.
A minor area of concern, MAPI noted, was the annual orders index, which is based on a comparison of expected orders for all of 2013 with orders in 2012; it decreased to 64 in June from 74 in March but remains at a relatively high level.
About the Author
IW Staff
Find contact information for the IndustryWeek staff: Contact IndustryWeek
