How to Apply Next Generation Lean Strategies
The first four articles of this series have established the need for current Lean practice to evolve and in addition laid out ideas for that progression. This article will establish a construct for practitioners to use in applying these new strategies.
If you are starting from scratch what will be described may seem a bit overwhelming. The physical deliverables needed to support a Next Generation Lean business transformation are nothing less than representative Value Stream Maps and MCT Critical-path Maps for all parts used in the manufacturing of the final product, from supply chain through distribution. Here, the word “representative” implies that not every part may require its’ own set of Maps, depending whether the amount of processing commonality between the various parts’ current value streams. The following will first show how Value Stream and MCT Critical-path Maps are used in combination; give an overview to implementation short-cuts, and; close with an example of how Next Generation Lean is applied.
Process
Today’s most frequently applied Lean analytical tool is the Value Stream Map, which pictorially depicts the flow of information and material through a factory. As far as they go, Value Stream Maps are powerful. Why? Because they visually facilitate employee understanding of the manufacturing plan. Also, because of that first point, they are the best approach I’ve seen to soliciting process improvement ideas. Value Stream Maps, however, have a shortfall in that they don’t employ a metric tying the flows they define to either executive level performance metrics or customer demand.
Hmmm! Can we think of a tool that does provide such a metric? If you’ve read this series up to this point you’ve learned that MCT Critical-path Maps do, in fact, can be tied to executive level metrics and customer demand. The point to be made here is that Value Stream and MCT Critical-path Maps complement and supplement each other. Value Stream Maps define in detail what happens in the manufacturing process. MCT Critical-path Maps quantify processing effectiveness in terms in both financial terms and customer response capability. They also provide insight to those areas offering the most potential for process improvement, i.e., their Red Non-Value Added segments. The two tools applied together, then, provide a basis for identifying and prioritizing Next Generation Lean project work. The following steps provide a simple approach to that work.
- Create a Current State Value Stream Map and based on it (as well as tagging—as described in the preceding article in this series) develop an associated Current State MCT Critical-path Map, which will define the Current State MCT.
- Define the MCT that will give your company a competitive advantage, i.e. market-based Build-To-Demand capability (again, as described in the preceding article in this series).
- Identify those segments in the Current State MCT Critical-path Map that seem to offer the most potential for MCT reduction.
- Review the targeted changes financially and compare their potential payback to your company’s minimum ROI thresh-hold.
- Implement projects on those targeted areas that meet or exceed the ROI thresh-hold.
- Create a Build-To-Demand Value Stream Map and develop its associated Build-To-Demand MCT Critical-path Map by retagging the updated process flow(s).
The process is shown below pictorially:
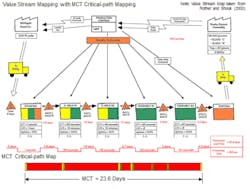
Here’s what a Value Stream Map looks like when with a MCT Critical-path Map:
It needs to be reiterated that a part’s MCT is comprised of the following;
- Supplier Operational MCT, including the lead-time equivalent of any Raw and pre-built Finished Goods inventory.
- The Transportation MCT from that supplier to your factory.
- Your factory’s Operational MCT, including the lead-time equivalent of any Raw and pre-built Finished Goods inventory.
- The Distribution MCT from your factory to customer availability.
It also needs to be pointed out that if you have multiple supplier tiers the Operational and Transportation MCTs of each is included in each tier level. Both Transportation and Distribution MCTs, though, usually don’t need to be documented through “tagging” since shipping times are well defined at most companies. The issue then becomes documenting in-house and supplier Operational MCTs with Value Stream and MCT Critical-path Maps. Getting suppliers to participate in this effort, then, is usually the biggest barrier to a company’s Next Generation Lean initiative.
I know this must seem like a lot of work. It is. As has been shown in the preceding articles of this series, though, the payoff can make it well worth the effort. There is a statistically significant amount of industrial experience that shows that if MCT reduction has not previously been the primary strategy behind Lean, reductions of 50% or more may be available without significant capital investment. Going back to the executive level financial metrics discussion, it is seen that reducing MCTs by 50% means the amount of Finishing Goods Inventory required to maintain current Customer Fill Rates can also be reduced by 50%. This is the sort of financial impact executives can’t ignore! Published industrial data also shows that a 50% reduction in MCT has the potential to reduce part and/or product direct costs by up to 10%, so the savings available through current Lean’s isolated Kaizen events is also delivered by Next Generation Lean. And, as should be expected with MCT Reduction, significant improvements in On-Time Deliveries to customers are also an expected outcome. Imagine that—On-Time Delivery performance improving as Finished Goods Inventories are reduced. So, again, the result is can obviously be worth the effort.
Supporting Activities
In-house:
A great deal of progress can be made in creating internal Value Stream and MCT Critical-path Maps with a minimum commitment of manpower. If you currently have Lean resources, dedicating two or three of them to the documentation effort will usually produce a complete set of Maps within a six to twelve month period. The resulting Maps then provide a basis—focus and priority—for all future internal Next Generation Lean activity.
Suppliers:
Two main issues are at play here. Both must be effectively dealt with to ensure a successful Next Generation Lean initiative. First, a high level of trust must exist between you and your suppliers. It’s a good jumping-off-point if your company manages its’ suppliers collaboratively! In addition, I’ve found that laying out the business case for MCT reduction goes a long way in selling suppliers on the need to support your initiative. Finally, showing suppliers that your own company is conducting a parallel Value Stream and MCT Critical-path Mapping effort will also help to remove any barriers to participation. In fact, sharing some of your own before and after Value Stream/MCT Critical-path Maps is a great way to show suppliers how they could benefit through participation.
Note: It is only human nature that suppliers will be more motivated to support activity that lowers your cost if they get credit from your purchasing function for that effort. In my mind, suppliers that go along with a customer’s request to create Value Stream and Critical-path Maps should get some level of “break” from the normal supplier competitiveness—translate piece-price reduction—improvement goals. Additionally, suppliers that then use the Maps to reduce their MCTs should receive an additional “break” from those same goals. This makes sense since suppliers are, in fact, helping improve your company’s financials—granted, outside of the traditional piece-price reduction approach. But the financial impact is just as real.
Along these lines I have always felt that a carrot was a better strategy than a stick for getting someone to work with you and, take my word for it—a strategy of “break(s)” from annual piece-price reduction goals—will be very effective in getting enthusiastic supplier support for your Next Generation Lean initiative. I know that implementing such “breaks” will likely require executive level sanction. However, if you effectively lay out the potential financial benefits to them you will have at least a fighting chance of getting the needed support.
A second issue in getting suppliers to provide you with the Value Stream and MCT Critical-path Maps of the parts you buy from them is giving them resource support as they get started. It is a given that they will have questions. If you aren’t able to answer their questions errors will be made and enthusiasm will be lost. Better yet, if you can provide on-site step-by-step instruction to suppliers on how to produce their Maps you’ll have quicker and more accurate start-ups. The best support scenario, however, is to have your resources available to work elbow-to-elbow with suppliers as they generate their initial Maps, i.e., teaching them “to fish”—take from me, you learn how to fish by watching an experienced fisherman fish—not from reading an instruction manual. Having an informational web site is also a good resource to offer.
I’ve always been a strong supporter of the Supplier Development function. Unfortunately, most suppliers I’ve worked with tend to regard offers of Supplier Development assistance as a threat to their margins. With Next Generation Lean, however, you have an instance where the Supplier Development support being offered takes the form of non-piece price associated activities, i.e., MCT—unlike piece-price—is a very non-threatening metric. And to boot, the SD support will help suppliers better understand their operations and what is needed to be more efficient. I can’t imagine a better entry for Supplier Development acceptance. If you don’t currently have a Supplier Development function an alternative strategy is to enlist a team of Value Stream/ MCT Critical-path Mapping specialists from your current Lean organization and send them out to work with your suppliers.
Implementation Tips
Parts generally are a member of a Part Family, i.e., a collection of parts with significant process and sequence similarity. If your product uses two or more parts from the same Part Family you may be able to use single Value Stream and MCT Critical-path Maps to represent all of them (as well as the rest of the parts in that family). The point you have to decide is how much similarity is needed in order to apply this strategy—I’ve never heard of it being used when there was less than 80% process overlap—as well as which representative part you want to use.
Here, I tend to favor a part using ALL of the processes used by any part in the family and then deducting any missing individual Process MCT segments from it to come up with part-specific MCTs for the other family members. If one of your suppliers intends to use this strategy I would strongly recommend you ask them for permission to review and OK the representative part they intend to base YOUR part’s MCT on.
- Commodity purchased material doesn’t need a Value Stream or MCT Critical-path Map. This is because commodity material is readily available local to a consuming factory. In the case of commodities, assume MCTs of zero.
- Place lower priority on getting supplier Value Stream and MCT Critical-path Maps for simple parts that, while not a commodity, are usually available on short notice. Maps will be needed for these parts but they usually are not—at least initially—on a product’s critical-path. You want to prioritize parts that you think may be on the critical-path.
- Suppliers of complicated assemblies should be given priority since the MCTs of such Tier 1 suppliers usually ARE on the critical-path. Furthermore, it is likely that supplier MCTs make up the vast majority of their MCT. If needed, be prepared to assist in launching a Value Stream and MCT Critical-path Mapping initiative with their suppliers.
Case Study
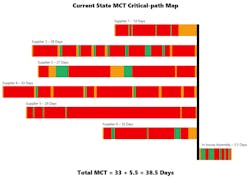
For this example assume that suppliers produce all of the parts needed for your product with your factory being primarily an assembler. Then, assume that you gain supplier support for your initiative and that they create the needed Maps. The following composite MCT Critical-path Map is the result of this collaboration:
From this you see that MCTs of the six involved suppliers range from 14 days (Supplier 1) to 33 days (Supplier 4). Your own internal MCT is 5 ½ days. The critical-path, then, is through Supplier 4 giving you an overall product MCT of 38 ½ days. Note: It is normal for supplier MCTs to represent the greater part of an OEM’s product MCT. Also, as previously mentioned, you can see that the largest portion—by far—of all MCT Critical-path Maps is composed of Red (Non-value Added- Unnecessary) low hanging fruit segments.
Since the top three supplier MCTs are 33 days, 29 days (Supplier 5), 28 days (Supplier 2) and 27 days (Supplier 3) it can be seen that working strictly with Supplier 4 to reduce their MCT will only yield an incremental four day improvement in overall product MCT, i.e., 33 will be replaced in the equation by 29. In fact, significant OEM product MCT reduction will not occur until successful projects have been conducted at each of the four highest MCT suppliers. Because of this it is decided that MCT reduction projects should be initiated at all six suppliers as well as in-house.
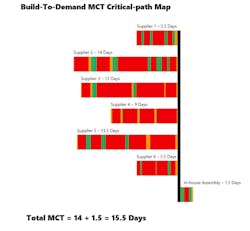
But what should the goal be for MCT reduction? After all, the Lean-ness end-game—Build-To-Demand capability—must be tied to having an edge in the marketplace. After reviewing the composite MCT Critical-path Map with Marketing, it was decided that reducing overall product MCT by 50% (which means MCT going from 38 ½ days to 19 ¼ days) would provide the needed competitive advantage. Consequently, over the next six months MCT reduction projects are conducted resulting in the following composite Build-To-Demand MCT Critical-path Map:
Now Supplier 2 with a MCT of 14 days has the longest supplier MCT and so replaces Supplier 4 on the critical-path. MCTs of the other suppliers as seen as coming in at 13 ½ days (Supplier 5), 13 days (Supplier 3), 9 days (Supplier 4), 5 ½ days (Supplier 6) and 5 ½ days (Supplier 1). In addition, the internal MCT was reduced to 1 ½ days, resulting in an overall product MCT is15 ½ (14 + 1 ½) days. The 19 ¼ Day MCT reduction goal was exceeded by 3 ¾ days (by almost 20%)—a great outcome! Future MCT reduction efforts will require projects at Supplier 5, Supplier 2 and Supplier 3 since all three have MCTs that are all essentially the same.
The next thing to do is to reduce the product Finished Goods Inventory by 60% (23 divided by 38 ½) and quantify the associated financial gain. Again, savings come from reduced Carrying Charges; reduced Transportation, Warehousing and Material Handling costs (due to the reduced amount of Finished Goods); reduced Damage and Rework (due to the reduced Material Handling); reduced Raw Material safety stock (as supplier resupply become more flexibile and consistent); and a reduced need for product discounts when demand is over forecasted.
Note: Discounting product from one year not only reduces profits for that year, it reduces sales in succeeding years that likely would have produced normal margins. And of course, your suppliers will realize similar cost reductions in addition to the normal benefits of isolated Lean and so in the coming years be in a position to share those savings.
I know that the above example isn’t realistic in that most products require parts from significantly more than six suppliers. I admit that becoming Lean—achieving market-based Build-To-Demand capability—requires a lot of effort over an extended period of time, particular on the supply side. But it has been achieved before and, in the last contribution to this series, I will cite two published articles that document that effort. The result—Lean supply chain performance—is well worth the effort.
I’ll end this article with the following quote from The Extended Enterprise (2004) by Davis and Spekman: "More efficient internal processes alone no longer measure operational excellence; it now entails more effective and relevant response to customers’ needs and requirements that often cross organizational boundaries."
Tools are important to the efficient implementation of any process. The next article in this series will discuss some that I am familiar with.
About the Author

Paul Ericksen
Executive Level Consultant; IndustryWeek Supply Chain Advisor
Paul D. Ericksen has 40 years of experience in industry, primarily in supply management at two large original equipment manufacturers. At the second he was chief procurement officer. He then went on to head up a large multi-year supply chain flexibility initiative funded by the U.S. Department of Defense. He presently is an executive level consultant in both manufacturing and supply chain, counting Fortune 100 companies among his clientele. His articles on supply management issues have been published in Industrial Engineering, APICS, Purchasing Today, Target and other periodicals.


