“The idea is not to broadcast everything to everybody, but rather to give them the information they need to do their job.”
That’s how Scott Miller, business manager, Visualization Software, sums up the Rockwell Automation approach when it comes to visualization and human machine interface (HMI). “Our job as information engineers is to provide the right data to the right person at the right time and place,” Miller says.
In the era of big data, of course, that challenge is more difficult than it appears. In Tuesday’s super session at RSTechED on “A Better View: Visualization to Drive Performance,” Miller noted that manufacturing is expected to be the leading contributor to big data in the enterprise. “With all this data, there is a tremendous number of options for how you present this information to the user,” he told attendees. “We want to present the right information at the right time to the operators, so they can collaborate and act on it accordingly.”
The most effective approach to display and present information through the HMI currently is in flux, with a new industry standard under development. Expected to be finalized later this year, the ISA 101 HMI standard will establish specifications for designing and using HMIs in manufacturing applications. The standard will cover every facet of HMI design and operation, including menu hierarchies, screen navigation, graphical presentation, alarming conventions, and security methods.
HMI standards are changing because manufacturers want more relevant information to be presented more clearly and intuitively for operators, along with greater context. “Our customers are globalizing, they’re asking more of their operations, and they want us to make the operation of equipment more intuitive,” explains Jason Wright, PlantPAx product manager at Rockwell Automation.
The impact good visualization can have on operations is obvious: the quicker an operator can realize there is a problem on the plant floor, assess it, find the root cause, and troubleshoot it, the greater the value derived from the HMI software in terms of operational uptime, fewer errors, and safer processes.
“There are a couple of levels of information, so that once an operator realizes there is a problem or an alarm has gone off, there is another set of information they can dig into,” Miller says. “They can check alarm logs or diagnostic logs, or look at the control code to understand what’s been causing these alarms to be triggered.” Adds Wright, “Visualization of the process allows you to take quick action. If there’s an alarm, you can quickly see the cause and take appropriate action.”
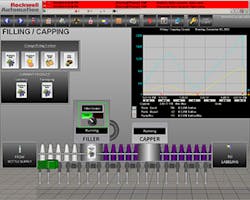
Industrial plants typically require different perspectives based on the operator’s role or the supervisory level of the viewer. For instance, various groups such as engineering, maintenance, and operations all need visualization into operations that is tailored to meet the needs of their role in the plant. “The HMI should be designed to allow the operator to achieve his goals,” said David Board, commercial project engineer, Rockwell Automation, in a presentation on “How to Improve Plant Operations through Better HMI Graphics” at RSTechED on Wednesday.
“The UPM enables managers to create reports, detect underlying trends, and accelerate decision-making,” Wright says. “One of the most important things is understanding exactly what that operator really needs to know. There is a growing realization that we need to provide more context for these operators to make decisions and provide them with more intuitive interfaces.”
An example of a company using the Unified Production Model is Cybertrol Engineering. Cybertrol used the UPM when setting up a process for a pipeline company that wanted enterprise-wide visibility. The pipeline company operates 150 pumping stations with Allen-Bradley ControlLogix PLCs at each station. The UPM was used to historically represent a massive amount of data from each remote station so that engineers could use the data for decision-making.
“The pipeline company wanted a user friendly, easily maintainable, flexible, off-the-shelf solution,” said Tony Kuznia, project engineer at Cybertrol, a systems integration partner, in a presentation entitled “Enabling Pipeline Process Data Visibility” at RSTechED on Monday. “For example, if they wanted to find the discharge pressure for a pumping station, they first would find the line, then the station, and then the attribute, using the Unified Production Model,” he explained.
Kuznia added that a control systems manager at the pipeline firm told him that UPM “has been a great tool for troubleshooting and analyzing various conditions and sequences.”
---------------------------------------------------------------------------------------------------------------------
Related Content
FactoryTalk View 7.0 - Video Playlist
FactoryTalk View Software Screens - Images
Top Five Missed Opportunities with HMI Alarms and Events - Article
RSTechED Session: VZ09 - Improve HMI through Better HMI graphics

