The Truth about High-Performance Analytics (Part Two)
Manufacturing is an industry ripe for Big Data transformation. The entire product lifecycle -- from the supply chain to post-production -- creates so much data. But, how do you harness all that data horsepower in a way that makes it easy to understand? Couple in-memory analytics with visual analytics, then stand back and watch what a difference it makes.
In a previous IndustryWeek column, I wrote about the transformative power of Big Data, especially when coupled with in-memory analytics. But, the gift of Big Data comes with the struggle to explore and present the information in a meaningful way. This is where visualization technologies paired with massive data sets can yield benefits to enhance and speed up the analytics lifecycle.
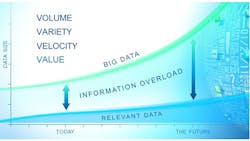
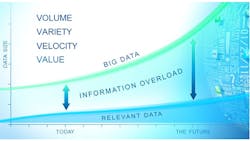
Our goal in dealing with this new normal of exponential data growth is to manage the relevant data’s Three Vs -- Volume, Variety and Velocity -- to get to the fourth V, Value (Figure 1). The Four Vs allow for new ways of seeing the business.
Pairing Big Data with Visual Analytics
Mining millions of rows of data can provide tremendous insight, but it is time-consuming and requires specialized training. Analysts need patience to sort through data to find game-changing information, then present it in a way business users can understand.
By pairing big data with visual analytics, organizations can use all their data and all their variables (rather than samples and subsets). They can explore the data quickly and visually see relationships that lead to where the deep dive of advanced analytical modeling should be focused.
This means domain experts and business managers can explore combinations of variables doing simple “drag and drop” selections, then run a linear regression or correlation analysis to see what emerges visually. When something interesting emerges, it can be passed on to data miners and statisticians for further analysis.
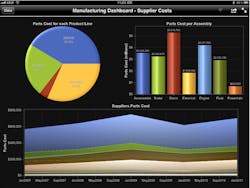
Business users also can use this technology to create simple reports on massive amounts of data without requesting IT help. For example (Figure 2), a car brand manager is asked to assemble a report about parts costs per assembly, per product line, per supplier all by 3 p.m. today. With an in-memory analytics + visualization technology approach, the manager not only creates the report, but also can push it live to mobile devices.
After further discussion, the data set could be sent to data scientists to build models and analyze results. Using this technology combo also means executives who want to view different slices of the data or the entire report can get what they need right in the meeting. How much more productive could meetings be if we eliminated the need for “follow-up” with a request for another report?
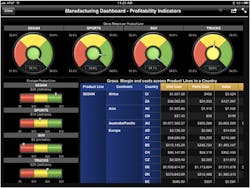
Not only can you transform your business productivity and effectiveness, visual analytics also deepens your existing advanced analytical capabilities. IT is freed up from creating ad hoc reports. Domain experts can work with the data. Analysts can focus on more sophisticated, predictive analytics. And since more employees can participate in creating the reports, users can even create their own dashboards like this simple, powerful one-page interactive report on profitability shown in several dimensions (Figure 3).
The Value of Using All Available Data
So, you can crunch billions of records in a fraction of the time it used to take at a minimal cost. But, if it still takes hours or days to select variables, test and validate models, select and validate a sample, or wrestle the data into a graph, chart or heat map that makes sense to business users, where’s the real value?
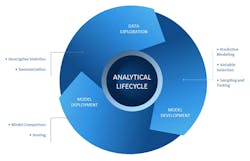
The analytical lifecycle has stages, and simply speeding up one part of it doesn’t necessarily mean a shortened cycle overall. Figure 4 illustrates the analytical lifecycle.
Visual analytics in-memory can make the data exploration phase work with all the data and all the variables. More importantly, it can empower business users to independently create reports and see data relationships without involving the IT department or data scientists.
Once the data exploration phase is complete, the next move is to involve data scientists to develop predictive models and deploy them against the data to bring additional value.
At this point, many organizations turn to sampling, or simply dump some of the data so the system doesn’t become bogged down. But sampling can miss nuance – sometimes in important ways. As discussed earlier, temperature sensor technology on factory robots is so advanced and cheap, it can sometimes report temperature readings every 2 milliseconds.
But suppose the data warehouse downloading that information can’t handle that volume, so a data analyst sets the data download to collect readings every five minutes instead. Unfortunately, the rest of the data is tossed. Why not use all the data and all the variables to detect patterns that could indicate impending equipment failure and costly downtime?
A more detailed level of data collection could better refine analytical models that would return a more precise estimate of equipment failure. And that means speeding up the lifecycle to deploy faster overall so the entire cycle timeframe is significantly shortened. Selecting accurate data samples, building models, testing models, deploying models all take time. Speeding up the phases of the lifecycle means a faster decision timeframe and a more competitive organization.
Keep in mind that visual analytics for the masses will not replace the need for advanced analytics in your organization. Advanced analytics are necessary to handle more complex analyses, especially those that involve prediction or optimization. But using visual analytics together with in-memory analytics changes how business users depend on analysts and data scientists for tasks they may be able to do on their own. And, that change can make the entire organization more agile, responsive and profitable.
Mike Newkirk is the Director of Manufacturing and Supply Chain Solutions at SAS.
