A No-B.S. Guide to Digital Twinning and Real-Time Sensor Data
B2B IoT and 3D modelling—also called digital twinning technology—is finally moving away from phenomenon status into everyday life. As the modelling trend matures, manufacturers are looking closely at unique ways to adopt this technology while pushing for a “digitally connected” factory floor.
In tandem with this, the emerging IoT area of real-time sensor data is creating new opportunities for manufacturers. Adding sensors to machinery and collecting the data generated is giving manufacturers the ability to track the health of machinery. This can save on time, resource costs and expensive line shutdowns.
For example, imagine having the capability to attach sensors to electric motors that drive conveyor belts and then collect data from those motors in real time. With some configuration and data analysis paired with digital alerts, factory employees would know a motor is starting to fail when things like temperature rise and/or vibration increases. The value in knowing when something will fail before it has reached a critical breaking-down point is the holy grail for manufacturers, because it ensures that manufacturing lines and other equipment continue to generate product that generates revenues.
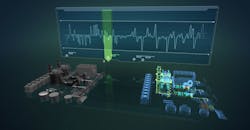
With digital twinning, virtual modeling meets IoT. Digital twinning lets operators build a 3D model of a facility and superimpose that real-time sensor data on that model. Real time sensor data is mapped onto a 3D model of the facility and visual clues are provided to allow the user to easily visualize what is happening.
Up to 85% of IoT platforms are predicted by Orbis Research to contain some form of this technology by 2022.
Breaking It Down
So, what does it take to create a digital twin and integrate things like IoT and modelling into your factory processes? Let’s break the steps down to give you a better understanding of how to turn these phenomenon into a virtual reality.
1. First, you’ll need to identify technology such as a 3D modelling tool to help you build your virtual facility. The idea is that pre-created library elements of common industrial equipment can be quickly snapped together using a 3D modelling tool. This includes everything from conveyor belts or equipment at oil refineries to grain silos on a large farm.
Combining these elements to create the 3D model can be a moderately complex task. However, a large logistics facility can be modeled in a few weeks with the right technology and team behind you.
Once you’ve built the model, it will become clear that in addition to timely reporting of possible breakdowns and ongoing data collection, a virtual 3D model is also very useful for planning new installations, especially if actual physical dimensions have been followed in its development.
2. With the model in place, sensors are then ported to the digital twin. If sensor data is already being captured into a suitable cloud via sensors, an interface called an API (application programming interface) is used to connect the cloud data to the virtual object. In the model, sensors are seen as virtual objects and they can be “wired” to the 3D model in different locations. With the right tools, this is a relatively straightforward task.
3. Once the cloud is connected to the virtual object, decisions on how to best display sensor data in the virtual model need to be made. For example, temperature can be color-coded so that motors running hot appear orange to red in the digital twin. Giving users the ability to zoom in on a specific motor can also trigger additional data such as actual temperature values, vibration, etc. Models can be displayed on a large screen and a mouse or touchscreen can be deployed to zoom and pan around the virtual facility. Virtual reality headsets can also be implemented, giving users the ability to tour the facility and check on the health of the connected components.
A View from Everywhere
In terms of data usage and display, IoT data is typically displayed on a dashboard (real time) or plotted on a graph (data over time). Under the digital twin scenario, the advantage of plotting the data onto a 3D model allows for more customization in the way the data is displayed. It also helps to create a better user interface for viewing data as it relates to the overall facility, because 3D models can be zoomed, panned, and rotated for better viewability.
Having a complete 3D model of a complex manufacturing or logistics facility and being able to zoom and pan into specific areas to see sensor data in greater detail provides far better visual cues as to what is going on compared to looking at a flat dashboard. Operators can deduce more information this way--and when analyzed properly, data can help to pinpoint and solve potential problems.
For example, the data could determine that a heat extraction fan is mounted too close to another piece of machinery, which could possibly be causing overheating issues and potential failure/breakdown. Maybe a motor is running hot, providing less than usual power and causing other motors to work harder, or a cooling fan is blowing hot air and making the air conditioner draw excess current.
While this may sound somewhat futuristic, all of this technology exists today. In fact, according to PWC, more than one-third of US manufacturers surveyed either already use modelling technology or plan to do so in the next three years.
John Burton is CEO of software startup UrsaLeo.
