U.S. manufacturing profits and revenues are roaring again thanks in part to the likes of Harley-Davidson Inc. (IW 500/192) and General Motors Co. (IW 500/4). Steel output, industrial equipment production, and oil and gas industry expansion also powered a record year for IW U.S. 500 manufacturers.
Traditional heavy manufacturing, often viewed as a bellwether for overall industrial health, was the big winner on this year's IW 500 list of the largest publicly held U.S. manufacturers based on revenue. Overall IW 500 revenues increased 17.2% from 2010 to $6.01 trillion in 2011. That breaks an IW 500 record dating back to 2002, and represents the highest overall revenues since IW 500 manufacturers' total 2008 revenue reached $5.8 trillion. Total profits also rose substantially to $556.9 billion, a 22% increase over 2010.
Manufacturing profits are benefiting from increasing market demand and declining raw materials and feedstock prices, says Thomas Runiewicz, principal and economist for IHS Global Insigh"During the recession, investment, especially capex, basically fell off the table," Runiewicz says. "Now there's been a lot of replacement and pent-up demand because a lot of the machinery they have is old. And also, a lot of machinery has been replaced to maintain a competitive edge for more efficiency. You see this a lot in the paper industries, chemical industries and food processing."
Average IW 500 revenue growth in the primary metals sector was 29.2% in 2011. Included in this category are companies such as Nucor Corp. (IW 500/60) , Schnitzer Steel Industries Inc. (IW 500/247) and Reliance Steel and Aluminum Co. (IW 500/124). Nucor's revenue jumped 26.4% to $20.02 billion. The company also was among IW 500 profit-growth leaders with net income up 480% to $778 million. The Charlotte-based steel recycler benefited from an average per-ton sales-price increase of 21%. The company shipped more than 23 million tons of steel to outside customers in 2011, a 5% increase over 2010.
On the transportation side, demand for medium- and heavy-duty trucks and cars received a boost from companies and consumers replacing older vehicles, Runiewicz says. Average revenue growth for the eight manufacturers comprising the IW 500 motor-vehicle segment was 23%. Profits rose at an average rate of 185%, excluding Wabash National Corp. (IW 500/486), which recorded a loss in 2010.
GM posted a record $9.2 billion profit in 2011, up 49% from 2010, just two years after emerging from bankruptcy. Motorcycle manufacturer Harley Davidson's profit reached $599.1 million, up 309% from 2010. The company cited consolidation of a production line at its York, Pa., plant and international expansion as earnings-growth drivers. Although revenue jumped 9.3%, the company fell 11 spots on the IW 500.
The oil and gas sector drove additional revenue and profit increases on the IW 500 as global demand and production from shale-gas resources expands. Perennial top-ranked IW 500 manufacturer Exxon Mobil Corp. posted revenues of $471.1 billion in 2011, up 26.5% from 2010. The company's profit grew 35% to $41.1 billion on higher crude oil prices and increasing global demand.
Lesser-known players realized dramatic earnings increases from their activities in shale plays. Markwest Energy Partners LP (IW 500/432) rose 26 spots on the IW 500 with revenue rising 27% to $1.5 billion. Markwest is a midstream natural gas processing and gathering company. The company operates in several shale plays and announced a number of expansion plans in 2011.
Technology Sector
In the technology sector, Apple Inc. (IW 500/9) was the shining star, jumping five spots on the annual ranking. The company realized revenue growth of 66% and a profit increase of 85% to $25.9 billion, bolstered by the success of its iPad and iPhone.
Industries that continue to struggle include manufacturers that supply the housing and construction sectors. Average profits dropped 32.6% for the wood-products sector. The industry also showed the slowest rate of revenue growth at 0.11%. Furniture and fixtures and stone, clay, glass and concrete products sectors also struggled in 2011.
Some notable companies that are not present on this year's IW 500 include Timberland Co., which VF Corp. (IW 500/110) acquired last June; Baldor Electric Co., which ABB Ltd. purchased on Jan. 27; and National Semiconductor Corp., which merged with Texas Instruments Inc. (IW 500/88).
For 2012, manufacturing growth is expected to begin slowing down with volume increases nearly even with 2011 at 5%, says IHS's Runiewicz. By 2013, growth will slow to approximately 3% as manufacturers' capital-investment needs are filled, he says. Also contributing to the slowdown is a projected drop in capital-equipment exports. "You're going to see some real struggling in terms of exports for capital equipment," Runiewicz says.
A drop in the euro against the dollar combined with increasing competition from European manufacturers could impact exports, Runiewicz says.
Click here for the IndustryWeek U.S. 500
Creating the IW U.S. 500
IndustryWeek partnered with Mergent Inc. to create the 2012 IW U.S. 500 ranking of the largest publicly held manufacturing companies with headquarters in the United States. Located in New York and Charlotte, N.C., Mergent has been collecting and delivering financial information for more than 100 years.
Led by Ricardo Angel, director of equity research, and Jeff Zazzaro, executive managing director, Mergent's global databases were used to identify all publicly held manufacturing firms meeting IW's selection criteria.
The actual revenue cutoff for inclusion on this year's IW U.S. 500 list was just over $1.1 billion. In addition to the team at Mergent, Erik Fine, a Charlotte-based information consultant, oversaw the data-collection effort.
The IW U.S. 500 includes:
• Manufacturing companies with a majority of their business in a manufacturing industry;
• Companies that generated less than 50% of revenues from manufacturing, but more revenue from manufacturing than the lowest-revenue-producing companies on this year's list;
• Oil and gas companies that derive at least 50% of their revenues from the refining of oil and gas products
• Companies that derive at least 50% of their revenues from manufacturing mined materials.
Mergent collected the financial data elements directly from reports distributed by the corporations. To more accurately reflect the companies' core businesses, only revenue numbers from continuing operations were used. The full IW 500 database is available at
www.industryweek.com/iw500-2012.
Where 2011 data is not available, 2010 data is provided. An "NA" appears where data was not available and an "N/M" shows in instances where data is not comparable (for instance, in profit growth where a company posted a loss in the previous year). For companies that have recently changed their fiscal-year end, the most recent 12-month figures have been used.
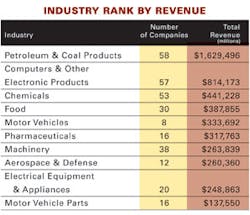
Industry Rank by Revenue
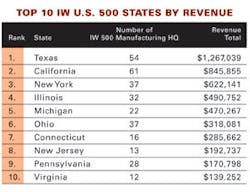
Top 10 IW U.S. 500 States by Revenue
About the Author
Jonathan Katz
Former Managing Editor
Former Managing Editor Jon Katz covered leadership and strategy, tackling subjects such as lean manufacturing leadership, strategy development and deployment, corporate culture, corporate social responsibility, and growth strategies. As well, he provided news and analysis of successful companies in the chemical and energy industries, including oil and gas, renewable and alternative.
Jon worked as an intern for IndustryWeek before serving as a reporter for The Morning Journal and then as an associate editor for Penton Media’s Supply Chain Technology News.
Jon received his bachelor’s degree in Journalism from Kent State University and is a die-hard Cleveland sports fan.


