Are You Overlooking Inventory as a Focus for Process Improvement and Waste Reduction?
This article is based on my observations the last few years when I’ve been invited into factories looking for help to start (or too often restart) a continuous improvement (CI) strategy.
The subject is inventory.
Back in the mid '80s, I made a career-long commitment to leading my organizations on a CI journey to achieve and sustain excellence. In those days the first thing we often looked at to find high-impact issues was the level of inventory turns and dollars. (Some of you may remember Robert “Doc” Hall’s 1983 book Zero Inventory? Some consider this to be the definitive work on JIT).
In contrast, my experience the last several years has been that inventory rarely is a focus at the plant level. And it’s not because inventories are in great shape. In fact the last plant I visited for the first time a week ago did not have any kind of a metric for inventory.
Yet inventory remains a key area where opportunities to significantly improve processes and eliminate waste can be found.
First, I acknowledge there are other similarly powerful metrics that can also surface huge opportunities for improvement. For example, in a sold-out plant, improving OEE (addressed in a previous article) and unleashing “free” incremental capacity is compelling. It might be scrap reduction for a wildly out-of-control shop floor.
But it might be inventory reduction. I’m simply suggesting that inventory should be part of the consideration when trying to expose processing issues.
Manufacturing plants always have two kinds of inventory: raw material (RM) and work-in-process (WIP). Some plants also have finished-goods (FG) inventory. Why is any of it there? In my experience these are representative reasons why:
Raw Material
- Typically RM is there based on: the supplier lead time of the material; the forecasted or known demand through lead time of the using plant; safety stock based on fluctuation in customer demand; or the supplier’s plant performance, e.g. delivery/quality issues. (There is also the typical categorization of A, B and C items of inventory based on volume usage and/or dollars. The earliest champion of this thinking in the 1970s was Oliver Wight, who was also the guru of material requirements planning, MRP; and later MRPII, manufacturing resources planning, now known as ERP enterprise resources planning.)
Work-In-Process
- WIP in a traditional factory is often based on scheduling time buckets of a week or more for each operation in the router. Since most processes take less than a week (some may only take minutes!), this results in excess inventory. In contrast, a lean factory operates with value streams, each with a balanced line. Safety stock is only what is ahead of the constraint work center while the rest of the inventory flows through in-sync kanbans based on the processing time from the supplying process. The difference between the two approaches often results in six or seven digits worth of excess WIP, not to mention lead times being quoted that usually are much longer than necessary. (Since inventory in the WIP stage also includes the RM, my last 10 years in the arena we measured plant inventory turns and dollars as RIP, i.e. RM + WIP = RIP. We wanted to increase the velocity of the inventory moving through the plants starting from the time RM came in the front door until the WIP transferred to FG out the back door.)
Finished Goods
- Typically FG inventory also is planned based on the same A, B, C categorization noted above under RM. And the thought process is essentially the same as RM relative to how much FG is required for the business.
- What is the customer demand for each product through both the suppliers’ and your factory’s lead time? What safety stock is required to protect the customer from stockouts due to forecast accuracy and/or plant performance problems? What safety stock is required based on a statistical analysis of how much demand fluctuates over time? Examples: seasonal customer demand patterns, marketing promotion plans.
Depending on company size the dollars tied up in inventory may be in the hundreds of thousands or the hundreds of millions or more. How much of that cash can be delivered as a one-time increase in free cash flow? (That in and of itself is compelling enough to get the senior executives' interest.) But at the plant level, understanding and analyzing why you have what you have, starting with your “A” inventory items, will also unearth huge process improvement opportunities that will impact both the balance sheet and the income statement in a positive way. For example:
- How much of RM is necessary because of quality, extended lead times and delivery performance issues by your suppliers? How often are you having excessive scrap or missed customer deliveries because of supplier problems? These are typically issues where much of the heavy lifting can be done for shop floor people by the materials/sourcing team and a quality engineer. They can cause significant plant improvements in terms of improving flow and eliminating cost and customer issues. Does your company have an active and comprehensive CI process that’s expected of your supply base? What formal process do they use to eliminate root cause?
- The level of WIP reflects flow interruptions. Why the interruptions? Perhaps your team doesn’t understand or use proper value stream mapping and line balance engineering. Processes are interrupted because of rework and scrap issues. These unfavorable numbers can be enormous. How much are you losing on scrap (labor, material, overhead)? How much capacity is being wasted as a result? How much overtime is being paid due to this poor performance? How many customers are being let down by the plant’s unreliable processes? Because of your cycle times? How much FG safety stock is required to “protect” the customer from late shipments because of the shop floor’s poor performance? (Remember that FG is the most expensive form of inventory!)
When you see excess inventory you can be sure that processing issues are being hidden. Here are a couple of basic truths:
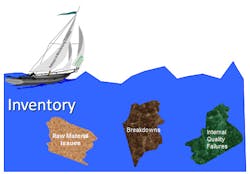
1. The longer any form of inventory sits, the colder the trail becomes to find and solve problems. Early in your journey this almost always leads to finding the process failures too late to avoid excessive rework, scrap and missed customer commitments. Our objective is to know about process variation, outside the norm, as close to real time as possible. The same premise goes for the supplier base as well. [See the figure below on how inventory hides problems -- we don’t know what the No. 1 issue to attack is until inventory is reduced enough to expose it.]
When I launched the CI strategy at my last employer in 1999, one the metrics we put into place was to measure and improve our manufacturing cycle times. In the base year, 1999, the average cycle time was 26 days. A bold objective was set to reduce the average cycle time to less than 10 days by 2003, a 62% improvement.
The first year the average was 21 vs. a goal of 20. Not quite on target but a great start of a 19% reduction.
The same kind of result was delivered in year 2 with 17 days vs. a goal of 15 -- another 19% improvement.
Then the third year the objective was blown away: target of 12 and an actual of 7.7 -- 77% better than year 2 and 70.4% improvement from the 1999 baseline. In short a 70%-plus improvement vs. the 62% goal and accomplished in three years instead of four.
This also helped to fuel another bold objective to reduce scrap by 50% in 3 years which was also accomplished as noted in a previous article.
And the improvements carried over into the FG warehouse as well. FG inventory balances plummeted by a quarter of a billion dollars from January 2002 to July 2003 as the benefits of shorter factory cycle times and the sell-off of excess inventory occurred. This was a 40% reduction in FG inventory. At the same time, service levels to customers improved from the mid 80% to the mid 90s in seven months.
“Parkinson's Law states: “Work expands to fill the time available.” Or, in the context of this article it also applies: “Inventory expands to fill the space available.”
About the Author
Larry Fast
Retired
Larry Fast, IW's Ask the Expert: Lean Leadership author, was founder and president of Pathways to Manufacturing Excellence and a veteran of 35 years in the wire and cable industry. He is the author of "The 12 Principles of Manufacturing Excellence: A Leader's Guide to Achieving and Sustaining Excellence," which was released in 2011 by CRC Press, Taylor & Francis Group, as a Productivity Press book. It was a best seller in its category and a 2nd. Edition was published Sept. 24, 2015. It features a new Chapter 1 on leadership, various updates of anecdotes, and new electronic tools on the accompanying CD. At Belden, where he spent his first 25 years, Fast conceived and implemented a strategy for manufacturing excellence that substantially improved manufacturing quality, service and cost. He is retired from General Cable Corp., which he joined in 1997 to co-lead North American Operations. Fast later was named senior VP of North American Operations and a member of the corporate leadership team. By 2001 the first General Cable plant had won Top 25 recognition as one of the IndustryWeek Best Plants. By 2008, General Cable manufacturing plants had been recognized for 19 awards. Fast holds a bachelor of science degree in management and administration from Indiana University and is a graduate from Earlham College’s Institute for Executive Growth. He also completed the program for management development at the Harvard University School of Business in 1986.

