Improving Your Pricing Strategy: Simple Steps to Increased Profits
In this challenging time, how should we establish the pricing for our goods and services? Price too high, and we lose customers. Price too low, and we leave profits on the table.
A wise CEO at a parts manufacturing company once referred to his business’s pricing system as a leaky bucket. It had holes due partially to its own complexity, as pricing depended on product stratification and customer stratification, as well as regional and local considerations. When faced with all these factors, it became difficult to sort the signal from the noise and identify which prices were incorrect or suboptimal.
A systematic approach to pricing can lead to significant margin enhancement in a turnaround environment. In this article, we will explore common examples of pricing defects, and present an approach for identifying holes in that leaky bucket and plugging them.
Examples of pricing defects:
- A product variant sold once a year has the same gross margin as the high-volume product it’s based on, which sells hundreds of units every day.
- A part sold in a repair kit has a lower gross margin than the item it repairs.
- A core customer gets the same pricing as a one-time or walk-in buyer.
An overly simplified approach can be to set all margins the same, aka “cost plus.” The merit of this is that it is easy to administer, and what sells or doesn’t sell provides very clear feedback from the market. It happens in startups and smaller organizations, as well as in some distribution businesses.
Realistically, not all product offerings will have the same margin potential. Cost-plus will leave money on the table for some products, while pricing others out of a competitive position in the market.
Profit optimization is inherently a tradeoff between volume and price, and a simplified cost-plus model isn’t optimal in most cases. Most companies evolve toward product lines or categories, each with their own pricing strategy. As the complexity increases, so does the effort required to maintain such a system, while responding to changing realities such as input costs, competitor pricing, substitute products and the like.
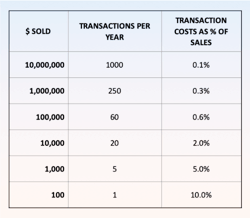
What follows (Chart A) is a prescription for periodic maintenance that considers some of the often-overlooked costs of doing business. These are often referred to as “transactional costs.” They typically don’t make it into product costs, but instead show up as Selling General & Administrative (SG&A) expenses, which we’ll call “margin eaters.” These can include labor for ordering, receiving and stocking, and payment for incoming materials. They may include design-related or maintenance activities for product catalogs, material safety data and marketing materials. All of these tend to be fixed or semi-fixed costs and they don’t scale much with volume. It may cost the same $10 of processing or maintenance, whether you order or sell one item or a thousand. As a result, we need a simplified approach that seeks higher margins on lower-volume products, to ensure that when low-volume products are sold, you aren’t effectively stapling $10 bills to the shipment.
Chart A
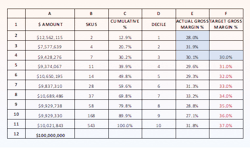
Let’s return to our CEO at a parts manufacturing company with the leaky bucket pricing dilemma. Here is the quarterly audit that we instituted (Chart B) which resulted in a 75-basis point improvement in gross margin:
Chart B
1. Within a product category, sort all the products based on sales volume from high to low.
2. Break that list into deciles (top 10%, next 10%, and so on down to bottom 10%). Sum up the gross margin for each decile. (Columns D and E)
3. Set a high-volume reference gross margin % expectation. This might be based simply on one item that’s highly competitive, but we found that averaging the top 3 deciles was a good universal starting point. (Blue shading, columns E and F)
4. From here add a small gross margin % premium to each lower decile. In practice we used something simple like 1% each time we stepped to the next lower decile. (Column F, rows 5-12)
5. Flag each item in the list with an actual gross margin % lower than its decile’s target gross margin %. Note: you will probably even have items in the top 3 deciles getting flagged.
6. Manually review each item and decide which ones can have their price and hence gross margin % raised.
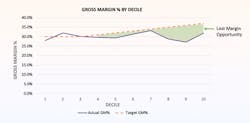
In Chart C below, you can quickly see large margin opportunities at the tail end of the product range. The shaded area below the dotted line represents about $2,700,000 of incremental margin opportunity if all the holes in the bucket were closed. That’s a 2.7% margin improvement of the $100 million category we show as an example. In practice, we found it hard to realize the entire amount initially, but did target a 1.0% improvement in our first pass.
Chart C
All of this math can be easily achieved in Excel or scripted into an ERP or BI system report. Similar logic can also be applied to your customer base, ensuring that while you are staying competitive for your most valued customers, you are not giving away margin to others.
Using quarterly reviews, we found over $10 million in incremental profit at that $1.5B manufacturer, and it wasn’t much additional work for the sales people involved. In fact, it ultimately made their lives easier. Finally, it institutionalized periodic pricing reviews and demystified the basis for how pricing was being set, monitored, and administered.
Kevin Carson is a principal with Firefly Consulting. He has spent more than 25 years working with clients on operational excellence, delivering impactful results that cross industries, corporate cultures, and geographies.


