Modeling Processes the Monte Carlo Way
We have all made decisions, whether in our personal or professional lives, based on imperfect information. How can we manage that risk and improve business outcomes? One answer is a statistical method called Monte Carlo simulation.
Monte Carlo simulation is a problem-solving technique used to approximate the probability of certain outcomes. This method simulates thousands of trial runs, using random values for each factor, based on predetermined probability distributions. Knowing the probability of certain outcomes provides better insight and leads to informed decision making. While based on statistical methods, with today’s software, Monte Carlo can be much easier to learn and apply to your business context.
Monte Carlo simulation is applicable to an array of scenarios, including:
- Business case development and ROI modeling
- Risk quantification associated with new product rollout and development costs
- Forecasting future sales based on uncertain market conditions
- Determining staffing requirements under various scenarios
- Estimating volume to produce based on downstream demand
- Estimating project completion date based on duration times for each activity
- Estimating the total cycle time for a process based on task durations for each step in the process
For example, let’s look at a core process within a paperboard manufacturing facility where paperboard is made from a pulp derived from wood chips. For obvious reasons, it is critical that wood chips are always available for the pulp mill.
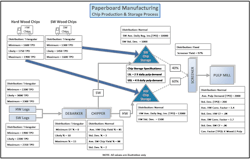
Pulp consists of a mixture of both hardwood and softwood chips. As depicted in Figure 1, some chips are purchased and sent directly to storage, and others are produced at the facility. To produce wood chips, logs are first debarked and then ground into wood chips, which are then sent to storage. Prior to use in the pulp mill, they are run through a screening system to ensure the pulp mill gets the proper sized chips.
Figure 1: Paperboard Manufacturing
Conducting the Analysis in Three Steps
Step One: Define the input variables or assumptions
This could be the variables on a process map, or simply the input variables on a spreadsheet. We’ll need to determine the probability distribution for each. If historical data exists, most statistical software packages can identify the best-fitting distribution. If data does not exist, it may need to be collected or gathered through input from knowledgeable staff. Often, a triangular distribution works very well by simply asking for information around the best-case, typical-case and worst-case scenarios.
Step Two: Determine the forecasted metric
In this example, the key metric is the ratio of available chips to the daily demand of the pulp mill. Available chips, in this case, are those purchased, produced, and currently in storage as shown on the process map in Figure 1.
Step Three: Run the simulation
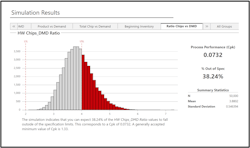
There are many software packages to run Monte Carlo simulation. The software used in this example is called Companion by Minitab. To ensure sufficient availability, the organization would like to have an average of 3 times the daily pulp mill demand for each type of chips, both hardwood and softwood, but no less than 2 days and no more than 4 days. Carrying too much inventory drives up cost and can degrade quality. Analyzing only the hardwood variety, Figure 2 shows the organization can expect an average supply of hardwood chips to be 3.9 times greater than the daily demand of the pulp mill and can expect to have and inventory of greater than 4 times the demand almost 40% of the time. Assuming an average hardwood pulp mill demand of 4200 tons per day (TPD) at $60 per ton, the pulp mill consumes about $252,000 per day of hardwood chips. Carrying inventory of more than the upper specification limit of 4 times the daily demand results in a significant opportunity for cost reduction. The question now becomes, “Where do we start with improving the process?”
Figure 2: Simulation Results
Improving the Process
The next phase in the process is called parameter optimization and refers to identifying the optimal settings on inputs that can be controlled. An extruding process, for example, may have to operate at no more than 2500F and no less than 1900F before scrap product is produced. In this example, there are three input factors that can be directly controlled: 1) purchased chips, 2) log throughput and 3) beginning inventories. All of these can be optimized simultaneously or one at a time to bring the ratio of available chips to daily pulp mill demand closer to the target of 3 days with less excess inventory.
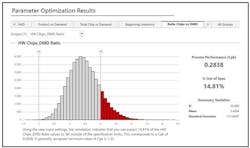
To illustrate parameter optimization, one input factor was chosen. Since purchasing chips from the outside is expensive, this was the obvious first choice. Assuming there is a minimum of 200 TPD that must be purchased to maintain favorable pricing, but no more than 500 TPD purchased, Figure 3 shows the results of parameter optimization, keeping all other input factors constant.
Figure 3: Parameter Optimization Results
Figure 3 shows a decrease in excess inventory from almost 40% in Figure 2 to about 15% and an average inventory of hardwood chips of 3.5 times the daily demand of the pulp mill, resulting in a 60% reduction in excess inventory and a significant cost reduction.
We live in a world of uncertainty and virtually every business decision has some level of risk. Most decisions have a multitude of possibilities, but knowing, understanding, and quantifying this uncertainty increases the chance of favorable outcomes. For process improvement practitioners, Monte Carlo simulation is an important tool and method to reduce risk and facilitate those decisions grounded on data and evaluation.
Mark Sidote is a Principal with Firefly Consulting, a firm specializing in innovation and operational excellence. Mark has delivered multiple lean transformation, continuous improvement, and process redesign effort. He has significant experience in Design for Lean Six Sigma, Lean Transformation, and Lean Six Sigma deployment.


