The Missing Metric in Manufacturing
The speed of money – how fast profits are generated by investments – is of prime importance to investors. Making money faster from the capital tied up in a business has always been the name of the game. When investing in complex, capital-intensive manufacturing businesses, this means finding new ways to generate profit as fast as possible from expensive production facilities despite the challenges that complexity breeds.
However, despite the desire of investors for faster returns, measuring and managing the speed of profit flowing from their assets is rarely done by manufacturers. Instead of return on assets, management teams pursue “margin,” or profit per product unit. All manufacturers can measure their product margins, but virtually none have the tools to precisely measure the speed of profit flowing from their equipment. Every CEO knows his margin level, but virtually none know their profit per machine hour.
Very few manufacturers are able to measure the profit per hour generated by their equipment. Most have never even tried. This is why we refer to “profit per hour,” or profit velocity, as the “missing metric.” Despite the speed of money-making being paramount to investors, manufacturers (with few exceptions) lack the tools to measure this metric and are, therefore, unable to proactively manage it.
With recent advances in information technology, this is beginning to change. It is now practical to measure and manage profit per asset hour regardless of the size and complexity of a manufacturing enterprise. In short, the “missing metric” of profit velocity is no longer missing.
The Manufacturing Challenge
Without ready access to precise and reliable profit per hour information, manufacturing executives and managers do the best they can by setting improvement priorities based upon the only detailed profit metric they have access to – the profit or margin per unit as reported by their accounting system.
But, unfortunately for their investors, when manufacturing management teams rely on standard profit per unit rankings to set policy on customer priority, product mix, market focus, pricing strategy, new capacity investments and the like, those policies are inherently biased in ways that actually slow down the enterprise’s overall flow rate of profit per hour. A lower average profit per hour leads to lower profits per quarter and per year, and lower returns to investors.
This problem is especially harmful to the thousands of manufacturers worldwide who produce extremely broad product lines with thousands of distinct part numbers from plants requiring significant capital investments. Their inability to measure and manage profit velocity leads to a pattern of decision-making that unintentionally drives investor returns down, well below the results those businesses can otherwise deliver.
The Measurement Myth
The primary obstacle preventing these manufacturers from harvesting far more of their true profit potential is the widely held belief that product unit margins fairly reflect the relative profitability of the various products in a product portfolio. The assumption is that ranking products by margin per unit will ultimately translate into more total profit and better shareholder returns. This is a myth – an incredibly costly myth.
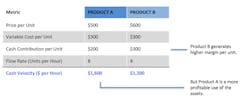
Unit margin over variable cost contributes the dollars to the pool of funds that drives the R in ROA (return on assets). As shown in the chart below, each unit of Product B, whose margin is higher than that of Product A, contributes more dollars to the profit pool. But does this mean that Product B generates a higher ROA than Product A? Not necessarily. What if Product A is produced twice as fast as Product B on the same production line?
Ranking products based solely on their margin per unit assumes that units of all products are equivalent (a ton is a ton), and that their primary difference is their relative margin dollars. In fact, margin per unit overlooks a crucial product attribute that drives that product’s ability to generate asset profitability: its production speed, or flow rate.
Asset profitability is the result of both cash per unit and the unit flow rate. Together, these determine the profit velocity of each product, its ROA. Unless both margin and velocity are taken into account, profit analysis is skewed and leads to choices that cut dollars from the bottom line.
Managing Very Broad Product Lines
For most manufacturers, the margin per unit metric is perfectly adequate to guide good decision-making. In labor-intensive manufacturing, the speed at which the various products produce profits while moving through equipment doesn’t matter much, because the production process does not require expensive capital assets.
But across a wide swath of industries—including electronic components, specialty chemicals, packaging, semiconductors, textiles, fabricated metal and plastic parts, steel, contract pharmaceuticals, etc.—a single manufacturer will typically produce several thousand product varieties (shape, size, capacity, strength, etc.) for hundreds of industrial customers from many production lines and plants.
For these ultra-high-product-variety, capital-intensive manufacturers, ranking products solely by unit margin without even considering their profit velocities undermines management’s ability to fine-tune the mix of business to maximize the profit yielded by their product, customer and asset portfolios. Conversely, when the profit velocity metric is relied on by management to set priorities, the evidence shows that 3+ percentage points of revenue will be added to the bottom line.
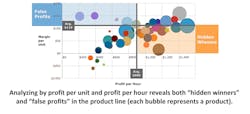
As depicted in the graph below, each manufacturer with a complex product portfolio has at least some “low-margin, but high-profit velocity” products. Known as “hidden winners,” these products are produced fast enough to more than offset their low margins.
With the metric of profit velocity, companies can identify their “hidden winners,” and instead of ignoring or rejecting low-margin (but high PV) orders, management can start taking that business from the competition. By preferentially loading their machine capacity with these “hidden winners”—using price reductions and other techniques—plant utilization and profit can rise despite those price reductions.
Additionally, management teams can also identify products that have high unit margins, but are so slow through the equipment that they have a low profit velocity, also known as “false profits.” Instead of pursuing more volume from these high margin/low profit velocity items, management can rethink their approach.
For executives, being able to viewa product portfolio from both the unit margin and profit velocity perspectives at the same time reveals new options for pricing, promotion, market development, deal negotiation, product definition, capacity planning and operational improvement.
By measuring the profit velocity of its 4000+ product varieties and then steadily cultivating the sales growth of its higher profit velocity products, a leading global packaging manufacturer drove pretax margins in its $2 billion North American business from 11% to 16% in two years. Annual operating profits rose by $88 million, an amount equal to 4.4% of revenue.
Once the executive team realized how they could use the profit velocity metric to wring more total profit from less total unit volume, they were able to shut down four low profit velocity plants, reducing overhead and further boosting total profit. At the same time, they kept reallocating more capacity to its high profit velocity products and customers—its “hidden winners.” Within seven quarters, this refocusing of the product mix and customer mix drove the “missing metric” of profit velocity up nearly 50%, from $1,031 to $1,509 per machine hour—from the same equipment.
Accelerating Profit Potential
To be able to see their previously invisible profit-gain opportunities, manufacturers need to measure the profit generated per hour for every product as it moves through production. By aggregating this information, especially by customer and product group, to understand how much profit per hour each order, product variety, each customer contract and production line contributes, managers can see a much clearer picture of the true sources of profitability in their business than that presented solely by the margin per unit metric.
Simply put, management teams must look beyond traditional cost-cutting and productivity-improvement programs to achieve and sustain superior shareholder returns. In today’s challenging economy, success depends on the ability to identify and capture hidden opportunities to extract greater profit from existing assets.
Measuring and then managing with the formerly “missing metric” provides management teams new opportunities to improve performance. Using the metric of profit velocity to guide decisions, manufacturers can increase cash contribution by 3+% of revenues from their assets, maximize capacity, master product mix and significantly boost returns on their investors’ capital.
Michael Rothschild isfounder and chairman of Profit Velocity Solutions, a San Francisco based company that has created a continuous profit improvement software platform. Rothschild is also author of Bionomics: Economy as Ecosystem, and has been a keynote speaker on the rapid evolution of global economic competition.


