The Growth Equation: How Predictability Helps Product Innovation
The previous article in this series introduced the four levers you can pull to increase your growth through new product innovation: Frequency, Predictability, Market Impact and Time to Revenue.
We’ve already covered Frequency, So now let’s take a look at the second lever—Predictability.
When I recently began working with a large OEM component supplier to diagnose some innovation problems, the development group was very critical of their own performance. But when I started asking about predictability, they told me that they almost always completed new products on time. That caused me to scratch my head; because that didn’t quite match up with everything else they had been telling me.
While the solution was far from ideal, our clever manager had identified several of the key elements of new product predictability—due date and scope. So we define Predictability as: The percentage of new products that you launch when initially promised and with all of the features initially requested.
For the financial folks reading this, you might also wonder about predictability of costs. Clearly, we all want to see projects come in on-time and on-budget. But delays and the associated recovery efforts are far and away the biggest drivers of cost overruns. Control the execution, deliver on time, and cost will usually take care of itself.
Plan for Obstacles
Everyone knows that it’s easier and less costly to catch problems at the front end, but it still amazes me how many companies try to get by with a few milestones and a list of tasks instead of investing just a few days in building a solid project plan that deals with the potential obstacles early. Maybe it’s just more of an adrenaline rush doing the firefighting later!
The kind of planning I’m suggesting doesn’t have to be complicated. Before any program enters the execution pipeline, just assemble a cross functional team to follow these simple steps:
- Set a clear and unambiguous charter for the project “Complete the sales launch for product X by Y date. Required features are A, B, & C.”
- Identify any potential obstacles you could encounter
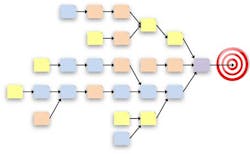
- Use sticky notes to visually plan right to left from the objective back to the inputs including paths around the obstacles. “In order to achieve X, we must first achieve Y and Z, and to achieve Y …”
- Make all assumptions explicit and call out the hinge assumptions. “Success depends on our lightweight technology being strong enough.”
- Evaluate feasibility for hinge assumptions as early as possible in the plan.
- Assign resources and durations to each task
- Identify the project’s critical chain1 and looks for ways to shorten it
When you’re done you’ll have a visual project network that your team can now use as a roadmap for your project.
Communicate the Cost of a Day’s Delay
But there’s one more step before you begin execution—communicating the cost of a days delay. A mid-sized security products company had a competitor eating their lunch with a new product. In trying to respond, they had fallen into the perfection trap. They had a solution that was “good enough” to stop the bleeding, but the project leader wanted to go further and leap frog the competition. A noble goal—but someone finally did the math and figured out that this relentless pursuit of perfection was costing $50K in lost revenue every day the product was delayed. The project leader was stunned to learn this; she immediately refocused the team on getting the existing solution into production and made leapfrogging a follow-on project.
Dashboard the Real Status of Execution
The 1/3-1/3-1/3 rule holds that few problems arise during the first third of a project. No one likes a complainer, so during the second third, the project teams glosses over emerging cracks and smiles for the management review. Of course, this only pushes the day of reconciliation out and somewhere in the last third of the project we can no longer hide the real status – and that’s when the adrenaline rush mentioned earlier comes into play as the firefighting begins to rescue the project. While this is going on, important resources are sucked away further cascading the delays to other projects.
To show the impact this has, I recently asked the engineering director for a local manufacturer if his managers spent their days in these types of firefighting meetings. “Not just my managers. I just came from one of those meetings myself. Come to think of that’s been most of my week.” His answer said it all.
Avoiding this situation takes a clear view of the road ahead and open transparent discussions about the progress each project is making. Again, with a Critical Chain plan, you have everything you need to create a dashboard for portfolio health. As long as the critical chain is getting done faster than buffer is being burned up, your projects are on track. When projects start to consume buffer too quickly, you get an early warning so that your team can take action to stay on track.
About the Author
Mike Dalton
Managing Director
Mike Dalton is the founder of Guided Innovation Group, where for nearly 20 years he has helped leaders in highly engineered product companies make new products a reliable competitive advantage. He has contributed numerous Industry Week articles and is the author of Unlocking Innovation Productivity and Simplifying Innovation.


