On Inequality and the Shift of Wealth in America
During the last Presidential election, Republican Mitt Romney railed against Democrats and Socialists whom he said wanted to redistribute the nation’s wealth and income. What he didn’t mention is that wealth and income had already been redistributed, and he was one of the recipients.
The great shift in wealth started in the 1980s, but really accelerated at the start of the Great Recession. This shift has been a big factor in the decline of the middle class and rise of serious economic inequality.
To set the stage, here are a few facts:
- From 2009 to 2011 (during the recovery) the richest 8 million families (the top 7%) saw their wealth rise from $1.7 million to $2.5 million.
- The bottom 93% saw a decline of $6,000 each.
- The top 7% gained $5.6 trillion in net worth, and the rest of the people lost $669 billion.
- The top 20% now owns 91.6% of the stock market.
- The big banks received bailout money while main street America suffered through 16 million foreclosures.
- The top 25 hedge fund managers earned as much as 658,000 entry level teachers.
- The richest 400 Americans increased their wealth by 54% between 2005 and 2007 (during the Great Recession), while the median middle-class family saw its wealth decline by 35%.
Is There a Real Shift in Wealth?
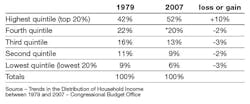
The gap between the haves and have-nots is widening at an accelerating pace. This has been documented by many economic studies. The following chart shows that between 1979 and 2007 the top 20% of working people gained a 10% increase in household income.
I don’t think that the average American begrudges the top 20% their income gains. What they resent is that the growth for the top 20% has come at the expense of the other 80% of working households (see chart).
This is a zero-sum game that has caused an ongoing furor over inequality and the fear that the average worker no longer has a shot at the American dream of upward mobility.
The problem is that this wealth transfer has created an inequality in America not seen since the Gilded Age, and it has inadvertently slowed down consumption and economic growth. The free-market capitalists were very disciplined, and pragmatic in their plan and got what they wanted in terms of more wealth, while the middle class was not unified and very complacent in their reaction. The following graphs show various aspects of the widening gap.
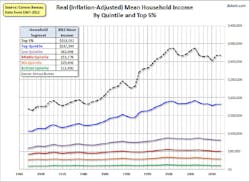
The chart above shows that the people making more than $100,000 per year have done very well, people earning less than $100,000 have had little growth, and those earning less than $50,000 per year have been stagnant or declining. The top 1% and the top 20% have done very well in the last 45 years, but the bottom 80% have seen little perceptible change.
From 1947 to 1979, the majority of working people did fairly well in terms of household income and wages. But after 1979, wages and household income began to decline or become stagnant for most of the middle class.
It is important to point out that if wages and income would have continued to grow at the post World War II rate, the median income would be $77,131 instead of $51,087. This is a difference of $26,044, or 33%, and would represent a good family wage that could provide a comfortable living in today’s economy.
Share of Total Income
The decline of middle class income also has resulted in the decline of the share of the nation’s total income going to the middle class. The following chart from the U.S. Census Bureau shows that middle-class share of income reached a high of 54% in 1968 and declined to a share of 45.7% of total income by 2012.
A prediction in the report, Technology and The American Economic Transition: Choices for the Future, published in 1988, suggested that if the trend in the 1980s continued, America would find itself in graceless decline, with living standards falling. That is exactly what has happened, and the middle class is in a “New Normal” for the economy. Yes, we are in the Post-Industrial Economy, and the assumption that living standards will improve from one generation to the next is in question.
Good Paying Jobs in the Middle
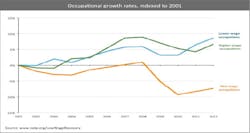
What are disappearing are the jobs in the middle, the good-paying jobs between $14 and $21 per hour with benefits. The following chart graphically shows how the mid-wage occupations are declining and the low wage jobs have been growing.
The Big Picture
Another way to examine inequality is to look at how the Top 1% made out in the last 80 years. According to Thomas Piketty, in 1929, before the Great Depression, the Top 1% controlled 22% of total wealth. In 1973, this had declined to 8% of total wealth because of changes in the tax rates and New Deal legislation. But by 2006, the the Top 1% again owned 20% of total wealth of the nation, which rose to 23.5% in 2007.
Why did this happen?
There is no simple answer for why the rich got richer and the poor got poorer. A combination of events including increases in lobbying money, deregulation, tax reduction, the decline of unions, the reduction of labor costs, consolidation and monopolies, and transition from manufacturing to service jobs; all contributed to the acceleration of inequality and enormous gains in wealth by the top 1%.
In an article “Wall Street is worried about inequality,” the economist Josh Bivens summarizes the inequality problem very succinctly: “The way I see it, the rise in inequality that we've seen, starting in the 1970s and rising pretty steadily through the following decades, can be explained by a bunch of intentional policy decisions. The decisions have basically undermined the bargaining power of low- and moderate-wage workers and shifted that power to corporate managers and people who own capital."
An example: the government has played a role in the middle-class decline and inequality by reducing taxes for the wealthy. Among other things that resulted from the two Bush tax cuts was that they gave the wealthy a 15% tax on capital gains, dividends and hedge funds. This not only increased the Federal Deficit, but gave a huge gift to the Top 1%.
The big difference between the years from 1930 to 1980, and the years from 1980 to now, is that the middle class shared in the prosperity of the pre- 1980 years.
The wealthiest people and corporations have succeeded in increasing their wealth perhaps even beyond their expectations. At the same time, the middle class has survived the last 40 years with little or no gain in household income. The big difference between the years from 1930 to 1980, and the years from 1980 to now, is that the middle class shared in the prosperity of the pre- 1980 years. They had a lot of leverage through unions, and many laws and regulations on their side under New Deal Democratic Capitalism. The only conclusion one can come to in evaluating these charts is that the redistribution of wealth came at the expense of the middle class.
The bad news is that the economy is not heading toward greater equality; the graph in Figure 1 is not showing any signs of going down as it did in the early 1930s. We are stuck at the top of the chart, with the Top 1% controlling 23.5% of the wealth.
Now, if you are part of the 1%, life is very good, and you are probably interested in supporting all legislation that maintains your position. But if you are in the middle or lower class, the future looks bleak, and inequality might get worse. Not only is there a slide in household income and wages, but the country isn’t working to eradicate poverty or hunger, we aren’t investing in our collapsing infrastructure, we are not expanding educational opportunities. The society that was built from the New Deal that propelled the middle class has virtually ended.
There are other problems associated with inequality:
Consumer Demand: One of the biggest problems of the new economy is that consumption has been reduced. In 2014, both Standard and Poor’s and Morgan Stanley issued reports about the dangers posed by economic inequality. The reports say that inequality is “actually threatening to become a drag on aggregate demand, which could in turn make the economy grow much more slowly and make it much less likely to achieve a full recovery.”
This statement is supported by the fact that GDP growth has averaged only 1.8% since year 2000.
Power: As the wealthy gain more money, they gain more power. It puts the rich into a position where they can spend more money on lobbyists to get richer still. The problem is that there is nothing in it for the 80%, who continue to worry about the collapse of their economic security, their jobs, their retirements and public services like public schools. The middle class lives in a period of great insecurity and uncertainty.
Effect on Democracy: A 2014 study by researchers at Princeton and Northwestern concluded that government policies reflect the desires of the wealthy, and that the vast majority of American citizens have ”miniscule, near zero, statistically non-significant impact upon public policy… when a majority of citizens disagree with the economic elites and or with organized interests, they generally lose.”
The French economist Thomas Picketty in Capital in the Twenty First Century, argues that “extremely high levels of wealth inequality are incompatible with the meritocratic values and principles of social justice fundamental to modern democratic societies," and that "the risk of a drift towards oligarchy is real and gives little reason for optimism about where the U.S. is headed.”
Well, the oligarchies are growing in the U.S. because there is very little antitrust activity by the Justice Department. Picketty’s prediction is right –- inequality is incompatible with modern democratic societies. The shift in wealth has not been good for the country, the economy, or for working people.
It will be interesting to see if a political leader will come along who can explain to the middle class how all of this happened, and organize them into a movement by offering the political and economic changes that will serve the majority.


